Ethereum is currently moving downward after a sharp price drop. The price fell from the high two thousands into the 1800s, and it has not yet found a strong reason to move higher. When traders look at the bigger picture, they often describe this as a descending channel. A descending channel is a chart pattern where the price makes lower highs and lower lows over time. In plain language, it means the price has a downward trend and there is not yet a clear sign that the trend has ended.
Right now, the market is in a phase where traders are trying to digest or absorb the big price change. The next big move is likely to depend on how the price acts around two important areas. On one side, there is resistance near 2700 dollars. Resistance is a price zone where selling pressure tends to appear, and prices often struggle to move higher. On the other side, there is a reclaimed support zone near 1800 to 2000 dollars. Support is a price zone where buyers tend to step in and push prices back up. If the price holds above this support area, a small recovery could be possible. If it breaks below it, more selling pressure could push the price even lower.
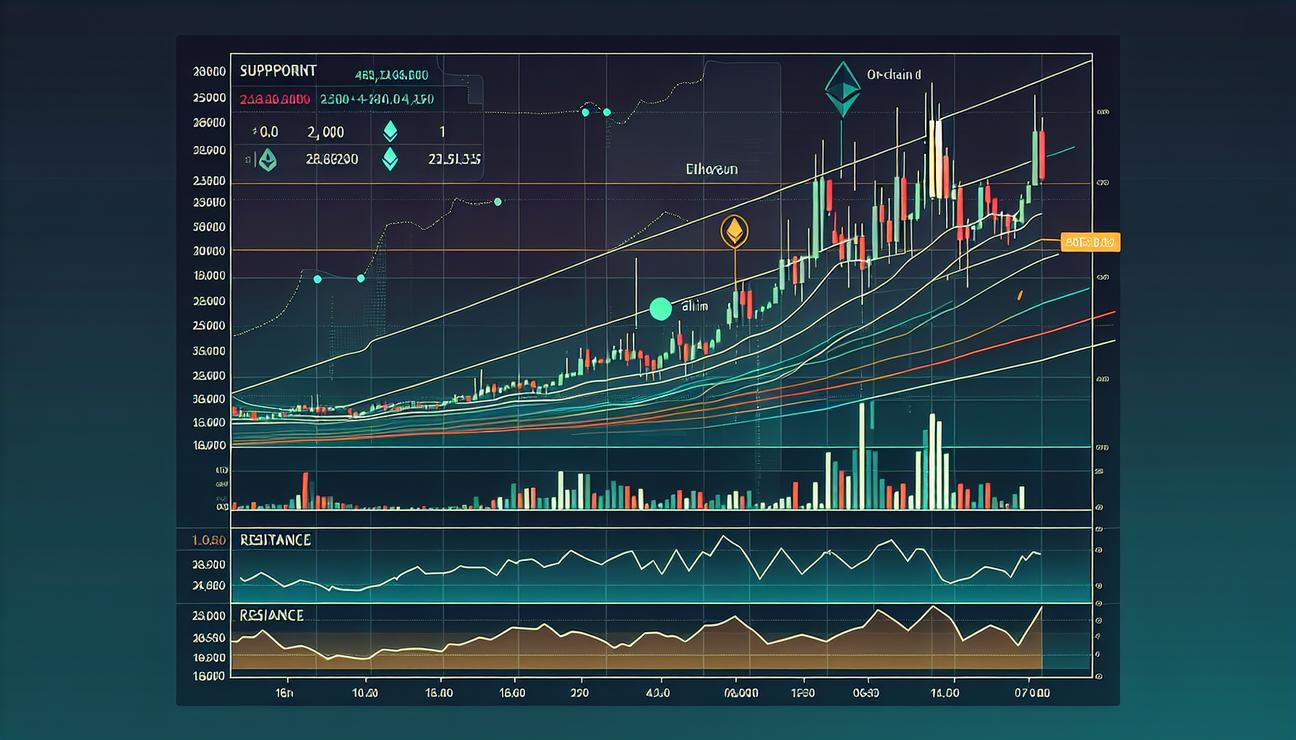
To help you understand what is happening, let’s break down the chart pieces in simple terms. We will start with the daily chart, then look at the shorter four-hour view, and finally talk about what happens on-chain, which means the actual movement of Ethereum on the networks and in wallets around the world.
The Daily Chart: A Broad Downtrend
On the daily chart, Ethereum is still moving inside a wide downward channel. A channel is like a corridor on a chart: prices bounce between a lower line and an upper line. In this case, the price recently fell to the lower part of the channel and reached a big “demand region” around 1800 to 1700 dollars. A demand region is a price area where buyers have shown they are willing to buy, which can stop the price from falling further for a while.
Even though buyers showed a first reaction in that zone, the overall pattern remains negative. The chart shows a series of lower highs and lower lows. This means every rally is weaker than the previous one and every new low is lower than the last. There is also a price gap around 2300 to 2400 dollars. A gap is an area on the chart where prices did not trade, which can become a hurdle for prices to rise in the near term.
For a more lasting change in the trend, Ethereum would likely need to push above 2400 to 2500 dollars and also rise above the middle of the downward channel. If that happens, it would be a sign that the downtrend could be weakening. However, as things stand, a durable move back to a bullish trend is not yet confirmed.
The 4-Hour Chart: A Short-Term Basing Period
Looking at the four-hour chart, the market has started to form a short-term base after the big drop. Prices moved down to the 1800 area, and then began to consolidate. On this shorter time frame, the momentum indicator called RSI (we will explain later) shows a bullish divergence. This means the price makes a new low, but the RSI makes a higher low, signaling that selling pressure may be tiring and a pause or small rebound could be possible.
Right now, Ethereum is trading in a range between 1800 on the bottom and about 2100 on the top. A range is simply a price band where the asset is bouncing back and forth. Traders call this the tactical battlefield: if the price stays above 1800, the market could test higher levels and possibly retest around 2200 to 2400. If the price breaks decisively below 1800, the downside could extend toward the next support area around 1600 or so in the daily chart view.
What Could Happen Next: Key Levels to Watch
The near-term path for Ethereum depends a lot on how it behaves in this 1800–2100 range. A sustained move above about 2100 to 2200 would be a sign that buyers are gaining strength and the price may try another push toward 2400–2700. On the other hand, a break below 1800 could indicate that the relief rally has failed and that prices may drift toward the next daily support around 1600 or lower. In such a situation, momentum could stay negative for a while, unless there is a strong shift in demand and a return of buying interest.
On-Chain Analysis: How Ethereum is Moving on the Network
On-chain data helps us understand how much Ethereum is available for sale and how much is being held by long-term holders. A key metric used here is the Exchange Supply Ratio (ESR). This ratio looks at how much Ethereum is kept on centralized exchanges (the places where people trade), compared to the total supply in circulation. A lower ESR means fewer ETH are on exchanges and more are kept in wallets, staking, or other custody methods.
Currently, the ESR for Ethereum has continued to trend lower and sits near the low end of the latest data range, around 0.135. This means only a small fraction of the total Ethereum supply is on centralized exchanges right now. In simple words, a lot of Ethereum is being kept away from exchange trading, either by holders storing it in wallets themselves or by staking it on the network. This reduces the immediate amount of Ethereum that can be sold on the market if prices start to fall again, which can make big downward moves more volatile when they do happen. In the short term, this setup can create bigger swings because the supply for sale is thinner. However, in the medium term, a low ESR combined with already observed downside often points to a late stage in a correction. That can mean it becomes harder to find new sellers if demand starts to recover.
Putting It All Together: What This Means for Investors
Right now, Ethereum is in a cautious phase. The price is moving within a downtrend, and traders are watching two crucial areas: the resistance near 2700 and the support near 1800–2000. A move above the resistance would be a sign of strength and could lead to a new up-move toward higher targets. A failure to hold the 1800 support could lead to more downside and test the next daily support around 1600.
Traders also pay attention to the short-term chart. If the price can stay above 1800 and push toward 2100–2200, the bias could shift slowly to the upside in the near term. The bullish signal on the four-hour RSI makes this scenario plausible, but it is not a guarantee. The overall trend on the daily chart remains down, so any recovery would likely be a corrective move within a larger downtrend rather than a complete change in direction.
For long-term holders, the on-chain picture matters a lot. Even if the price remains choppy in the next weeks, the fact that fewer Ethereum is sitting on exchanges could help limit sudden sell-offs if buyers return. This dynamic can contribute to a steadier environment once demand returns and the market digests the losses from the recent price drop.
Definitions and Quick Explanations
Because some terms can be technical, here are simple explanations of the most common concepts mentioned in this article. Short, easy examples follow each term to help you understand better.
- Ethereum — A decentralized computer platform that uses smart contracts. Its native currency is called Ether (ETH). It moved from proof-of-work to proof-of-stake in an upgrade called The Merge. Learn more on Wikipedia.
- Relative Strength Index (RSI) — A tool used to measure how fast and how much prices have moved recently. It helps traders see if an asset is overbought (too expensive) or oversold (too cheap). It is usually shown on a scale from 0 to 100. An RSI below 30 often means oversold; above 70 often means overbought. Learn more on Wikipedia.
- Technical analysis — A way to study price charts and other market data to guess where prices might go next. It uses patterns and indicators. Some people believe it helps, others think its usefulness depends on other factors. Learn more on Wikipedia.
- Cryptocurrency wallet — A place to store the keys (like passwords) that prove you own digital money and can send it. Wallets can be on a device (hot) or offline (cold) for extra security. Learn more on Wikipedia.
- Cryptocurrency exchange — A marketplace where people can buy, sell, or trade digital money for other assets. Exchanges can be centralized (run by a company) or decentralized (run by the network itself). Learn more on Wikipedia.
Notes: The information above reflects observations from current market data and typical chart patterns. Price movements are influenced by many factors, including investor mood, news, and technology developments. Always consider multiple sources and your own risk tolerance when making investment decisions.