Ethereum, often just called ETH, is showing continued weakness in a larger price pattern. The price is below important average prices and is moving inside a downward path. In the short term, prices have found some stability near a price area where buyers tend to step in. But on longer time frames, the trend still looks unfriendly for holders unless ETH can gain momentum above some key levels of resistance.
To understand what is happening, we can look at two main views: the daily view and the short four-hour view. The daily view helps us see the broader direction, while the four-hour view can show shorter shifts in momentum and possible new moves.
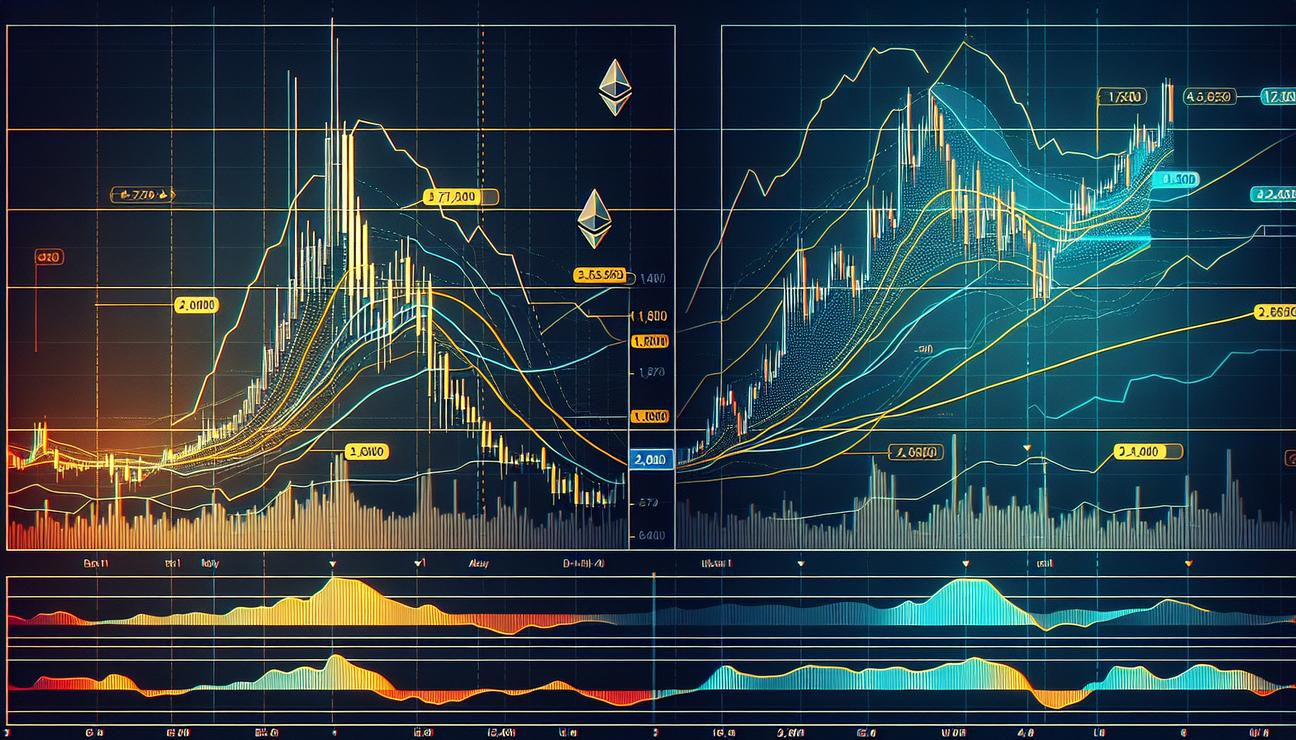
Daily Chart Analysis
On the daily chart, ETH appears to be moving inside a downward channel. This means the price keeps making lower highs while often staying below important price lines called moving averages. A moving average is a simple way to track where prices have gone by averaging them over a set number of days. Think of it like drawing a smooth line through many daily prices to see the general path. In the ETH case, the moving averages people watch are the 100-day and 200-day lines. When prices stay below these lines, it is a sign that the market trend is downward for now.
Recently, the price broke lower and reached a zone around 1,750 to 1,800 dollars. This is called a demand zone—a price area where buyers are usually quick to come in and support the market. Buyers did show up there, which slowed the fall a bit. Still, the overall setup remains bearish. This means the long-term mood is negative, and rallies can be limited unless buyers push the price higher with strong momentum.
The 2,300 to 2,400 dollar area now acts as a key resistance region. It sits near where the price recently broke down and also sits just below the 100-day moving average. If ETH can climb back into this zone and push above the upper line of the downward channel, a deeper rally could begin. But until that happens, any rallies are likely to be correction moves within the downtrend rather than a clear reversal. There is still a real risk that the price could move back toward lower support levels within the channel.
ETH/USDT 4-Hour Chart
Looking at the four-hour chart, ETH has been squeezing into a symmetrical triangle. This pattern is formed by lower highs and higher lows that come closer together as time passes. It sits above the 1,800 dollar support level, which has kept the price from falling further in the short term. A symmetrical triangle reflects uncertainty among traders. Both buyers and sellers are active, but neither side has taken clear control yet.
A move above the 2,000 to 2,100 dollar range on the upside would be the first real sign that momentum is shifting in the short term. If that breakout happens, it could open a path toward the 2,300 to 2,400 dollar resistance band mentioned in the daily view.
On the downside, if the price breaks below the 1,800 dollar base, the idea of the triangle’s consolidation would be undermined. That could invite renewed selling and a test of lower support levels, possibly resuming the downtrend in the short term.
On-Chain Analysis
On-chain data looks at what is happening on the Ethereum network itself. One important metric is the number of active addresses—the number of different wallets that participate in sending or receiving ETH. Recently, this metric showed a sharp spike. The 30-day exponential moving average (EMA) of active addresses rose to multi-month highs. An EMA is a kind of moving average that gives more weight to newer data, making it more responsive to recent changes. You can read more about moving averages here: Moving average.
Historically, when activity on the network grows a lot, we often see bigger price moves and more volatility. However, a higher level of activity does not always mean that prices will rise. In this case, even though more people were using ETH, the price did not yet show a clear bullish reversal. This kind of situation can happen when many participants are selling into the market at low prices—a sign of panic selling by weaker hands. If the higher activity continues but the price starts to stabilize, it might help form a base for a future move. On the other hand, to confirm a real uptrend, ETH would need to break above the key resistance levels described above and sustain that move.
To summarize the on-chain picture in simple terms: more people are using Ethereum, but that alone does not guarantee higher prices. The next big move will likely come after a clear move above important price zones with enough momentum to sustain it.
The analysis above echoes a common question among traders: Is the current support strong enough to prevent a further drop, or is it just a pause before another leg down? Investors should watch how ETH behaves around the 1,800 support level and the 2,000 to 2,100 range. A decisive move beyond these levels with sustained momentum would provide better clues about the next direction of the price.
What This Means for Investors
For someone who owns Ethereum or is thinking about buying, here are key takeaways in simple terms:
- Long-term trend: The general direction still looks down. This means that even if there are small rallies, the bigger move could be lower unless important resistance is overcome with strong momentum.
- Short-term moves: In the last few days, prices have paused near a support zone around 1,800. If buyers cannot push the price above the 2,000–2,100 area, any upward moves may be limited and could be followed by fresh selling.
- Important zones to watch: 1,800 as support; 2,000–2,100 as a first sign of strength; 2,300–2,400 as a bigger hurdle. A clear break above these zones, especially with momentum, could lead to more upside.
- On-chain signals: A surge in activity on the network does not automatically mean higher prices. A sustained price rise would need to be supported by a real shift in buying pressure and a break above resistance.
In short, ETH faces a delicate balance between potential short-term stabilization and the need for a clearer, stronger move higher to confirm a trend reversal. Traders will be watching price action near 1,800 and the 2,000–2,100 band, as well as the larger 2,300–2,400 resistance area. The network activity hints at growing interest, but price action must follow with a decisive breakout to the upside to shift the current narrative.
Glossary (Simple Explanations)
- Ethereum (https://en.wikipedia.org/wiki/Ethereum): A large, shared computer network. It lets people run programs and services without a central owner. Its digital money is called Ether (ETH).
- Moving average (https://en.wikipedia.org/wiki/Moving_average): A simple way to show the average price over a set number of days. It helps smooth old price data so you can see the general direction of the market.
- Decentralized finance (https://en.wikipedia.org/wiki/Decentralized_finance): Financial services built on blockchain that do not rely on traditional banks. They use computer programs called smart contracts to handle lending, borrowing, and trading.
- Smart contract (https://en.wikipedia.org/wiki/Smart_contract): A computer program that runs automatically when certain conditions are met. It helps people agree to things like payments or transfers without a middleman.
- Proof of stake (https://en.wikipedia.org/wiki/Proof_of_stake): A way for blockchain networks to choose who creates the next block. It works based on how much of the network’s cryptocurrency you hold and lock up (stake), rather than solving math puzzles as in proof of work.