XRP is the digital coin used on the XRP Ledger. Traders are watching it closely to see if it can show more strength in the near term. A market analyst known online as EGRAG CRYPTO said XRP is moving above a long-term price line called the 200 EMA and above a price level near $1.55. If this happens on a weekly chart (which means looking at data for a full week), it would be a sign that the price could be stronger in the short term.
Even with this possible move, XRP is still inside a downward price path. This is described by a descending channel, a shape where prices tend to move lower while staying inside two sloping lines. Because of this pattern, the overall trend is still considered corrective or bearish until XRP can break out above higher levels. If it can break above about $2.20, the chart pattern could shift to a more bullish outlook.
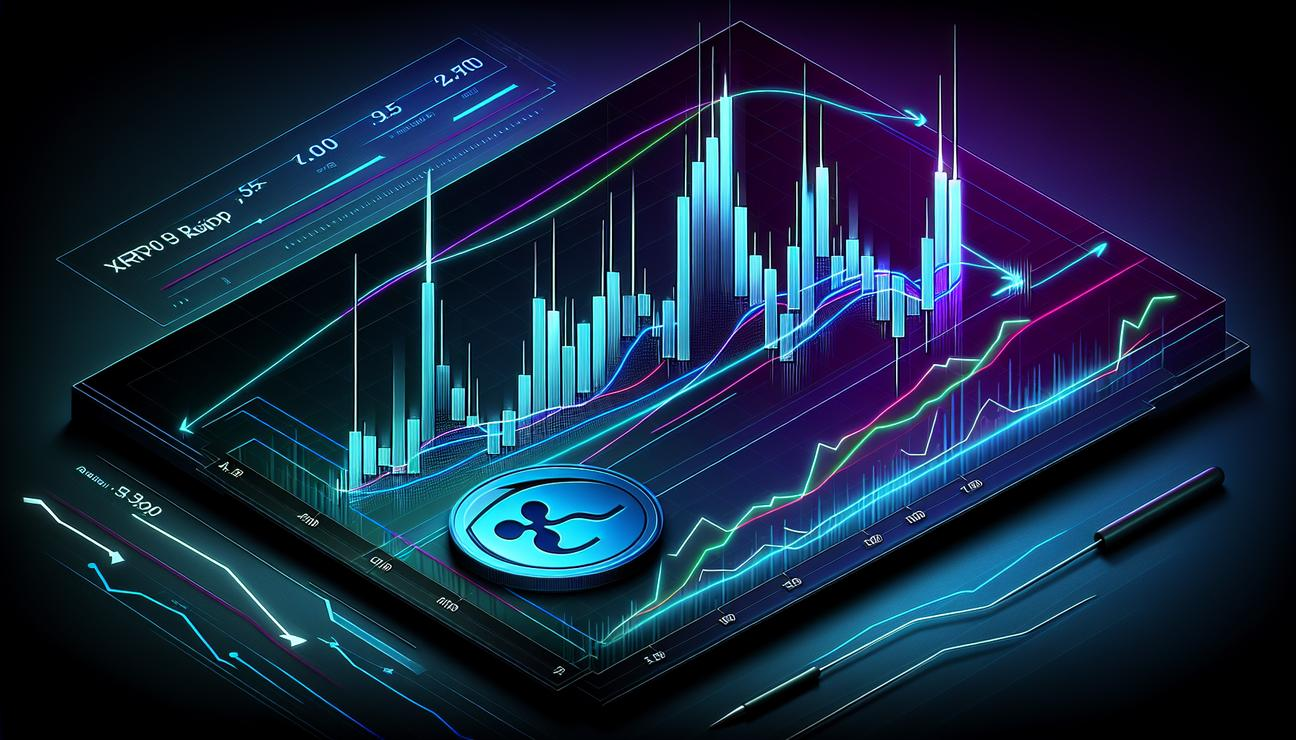
What the chart is showing
The analyst explained that if XRP closes the week above $1.55, the current downward move could weaken. A weekly close above $2.20 would make the bearish pattern unlikely and could open the path to higher targets around $2.70 to $3.60.
If XRP fails to reclaim $1.55, the next possible move could be toward $1.26. From there, there might be a drop to macro support (strong price levels that buyers tend to defend) between roughly $0.95 and $0.85. The analyst gave two chances for what could happen next: a 55% to 65% chance of a deeper move downward, and a 35% to 45% chance of an early breakout reclaim.
There is a line in the analyst’s note: “Structure > Emotion.” This means that the actual price pattern—the way the chart is formed—matters more than how people feel about the market. The price structure, not mood, is what traders watch to judge direction.
Right now, this disagreement comes as trading activity in both futures and spot markets seems to shrink. Another analyst, Amr Taha, noted that XRP futures open interest has fallen about 70% since October 2025, dropping to around $203 million. Open interest means the total number of open futures contracts that have not yet been settled. When this number falls, it can indicate that leverage (the use of borrowed money to trade) is being cleared out, which can lead to a pause or a bottom, but it does not guarantee a rebound.
In another update, it was mentioned that Binance’s open interest fell below $270 million. Those levels had not been seen since April 2025, before a big rally. Historically, these resets can coincide with local bottoms because risky positions are reduced, though they do not guarantee that prices will rise again.
Recent price action
As of the latest data, XRP had risen about 4% in the last 24 hours and about 3% over the past week, according to CoinGecko. This comes after XRP climbed from a recent low near $1.27. Still, XRP is down more than 12% in the last 30 days and about 40% over the past year. It is also more than 61% below its July 2025 all-time high of $3.65.
The rebound has happened within a relatively small price range of roughly $1.34 to $1.42 in the last day. The overall market cap for XRP sits near $86 billion. Now the immediate focus is how XRP behaves around the key level of $1.55 on a weekly close. If it can close above $2.20 on a weekly basis, the chart would look different and the suggested bullish path could become more likely. If it cannot reclaim the 200 EMA, the current downward channel would likely stay in place and traders would look to lower support levels for signs of a bottom.
In summary, XRP faces a fight between two important ideas: a potential break above key levels that could signal strength, and the ongoing downward pattern that has defined its action for months. The next few weeks will show whether buyers can push XRP above $1.55 consistently and then above $2.20, or whether sellers regain control and drive the price lower toward the next set of supports.
For readers who are new to this topic, a quick recap of a few terms can help. This article uses several terms from price charts and markets. Here are simple explanations with links to more information if you want to learn more:
- XRP – The digital coin used on the XRP Ledger. The XRP Ledger is a payment system built in 2012 by a company called Ripple Labs. The ledger uses XRP as its native coin, and it can also support other types of value.
- Moving average – A line on a chart that helps smooth out price data to see trends. A 200-period moving average is a long-term line used by many traders to judge the overall direction.
- Chart pattern – A shape or pattern seen on a price chart. Traders study patterns to guess whether prices will move up or down. Patterns can signal reversals (changing direction) or continuations (the same direction).
- Open interest – The total number of outstanding derivative contracts that have not yet been settled. A drop in open interest can mean fewer big bets on price moves.
- Futures contract – A contract to buy or sell something at a price agreed now for delivery later. These are standardized and traded on exchanges. They are a common way investors bet on prices going up or down.
Note: The information in this article reflects recent market activity and analyst commentary. Prices can move quickly, and predictions are not guaranteed. Investors should do their own research and consider their own risk tolerance before trading.