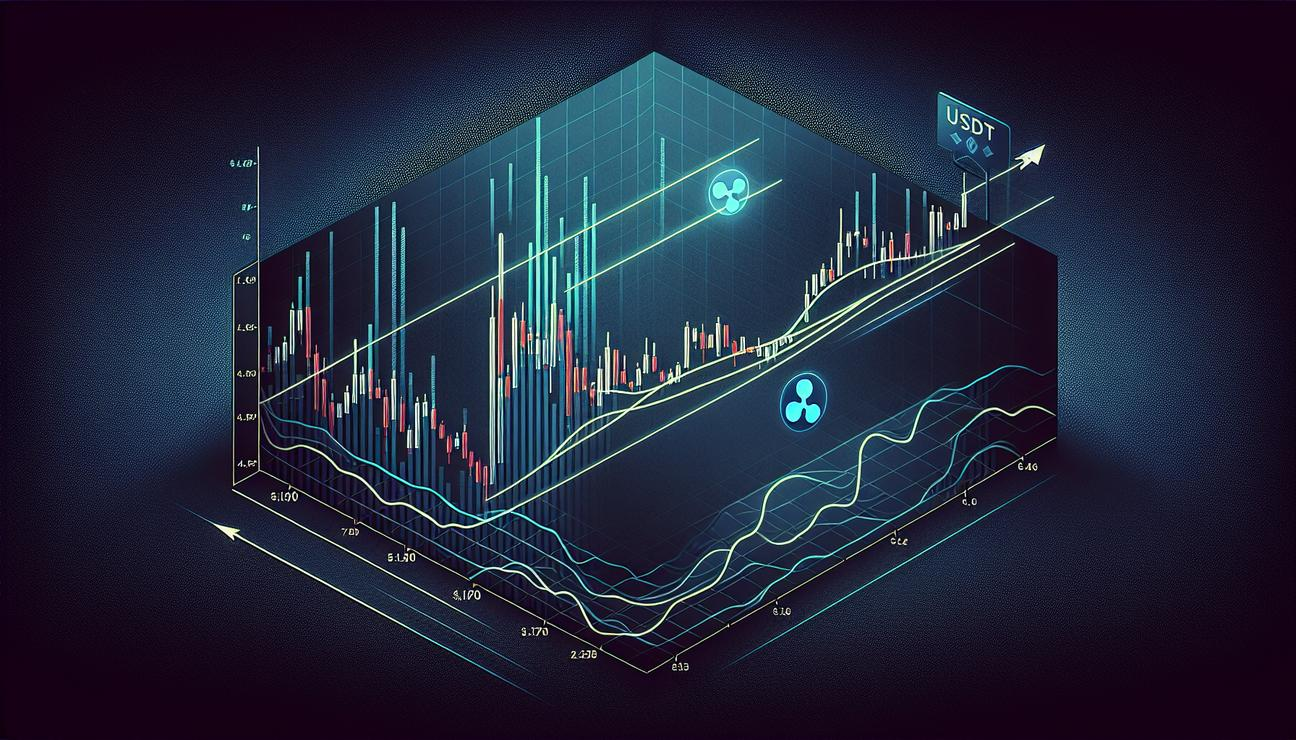
Ripple price analysis: USDT pair
XRP, the token used in the Ripple system, is facing selling pressure on the USDT market. This means the price is more likely to go down than up for now. The broader picture still points to sellers having the upper hand. In the short term, there are small signs of stabilization near some important price levels, but a real recovery needs stronger moves later on.
To understand what is happening, think of the price moving inside a slanted box that goes downward. This is called a descending channel. When the price stays inside this box and keeps making lower highs and lower lows, the trend is considered bearish. For XRP, the current price is around $1.36 on the USDT pair. It has not been able to climb back above two important lines: the middle of the channel and two big moving averages. Those averages are like price guides that show the longer-term direction. Here, the 100-day moving average is around $1.80 and the 200-day moving average is around $2.20. These guides are now acting like ceilings that the price needs to break through to show real strength. If XRP can’t rise above these levels, the downtrend could stay in place.
On the downside, the area between $1.10 and $1.20 is very important for the near term. This zone sits at the bottom edge of the descending channel and has recently seen more buying interest. If the price falls below this zone decisively, it could open the door to a deeper drop.
If buyers want a comeback, they first need to push the price above $1.80. That would be the first step toward testing higher targets, especially near the $2.40 to $2.50 range where there is new resistance. The Relative Strength Index (RSI), a tool that shows how strong price momentum is, has improved a bit. However, it does not yet show a real rush of buying power to confirm a sustained rise.
Ripple price analysis: BTC pair
The XRP/BTC pair tells a similar story of weakness. XRP is trading lower and stays below the main moving averages. The price sits around 2,000 satoshis (sats). A cluster of resistance around 2,200 to 2,400 sats has formed where the 100-day and 200-day moving averages meet. This makes it hard for the price to move higher. The repeated failure to break above this zone shows that buyers do not yet have control.
The key support on this chart is near 2,000 sats. XRP is testing this area again. If it breaks below it, the next possible spots to watch are around 1,500 sats and maybe even 1,200 sats over time.
If buyers can defend the current levels and push back above 2,400 sats, the next upside targets could be around 2,700 to 2,800 sats. After that, the major resistance area sits near 3,000 sats. But for now, the trend stays down. XRP needs to reclaim lost ground before the BTC pair can start to look more constructive.
In summary, XRP faces a challenging period on both the USDT and BTC markets. The path to a stronger recovery requires breaking above key moving averages and higher resistance zones. Until that happens, the momentum remains tilted toward the bears.
Definitions
- XRP Ledger — The XRP Ledger (XRPL), also called the Ripple Protocol, is a cryptocurrency platform created in 2012 by Ripple Labs. It uses a consensus system among validators and supports the native cryptocurrency XRP, along with other tokens and values. For more, see XRP Ledger.
- Bitcoin — Bitcoin is the first decentralized cryptocurrency. It was created in 2008 by a person or group using the name Satoshi Nakamoto. It runs on a peer-to-peer network and a public blockchain. Transactions are verified through mining, which is the process of solving complex math problems. For more, see Bitcoin.
- Tether (cryptocurrency) — Tether, also known as USDT, is a cryptocurrency called a stablecoin. It is designed to stay close to the value of the US dollar (1 USDT = about 1 USD). It is issued on multiple blockchains. People use it to move money around without big price changes. For more, see Tether (cryptocurrency).
- Moving average — A moving average is a way to smooth out price data by taking the average of prices over a certain number of days. It helps show the longer-term trend and reduces short-term fluctuations. Common types include the simple moving average (SMA). For more, see Moving average.
- Relative strength index — The relative strength index (RSI) is a tool that measures how strong recent price movements are. It helps show whether a market is overbought (too expensive) or oversold (too cheap). It is usually calculated over 14 days and has a scale from 0 to 100. For more, see Relative strength index.
Leave a Reply